
Category: Map of the Month
Map of the Month – April
Joy Ward and Bianca Acha-Morfaw
This month, our map is influenced by Earth Month, an initiative to raise awareness of global environmental challenges and to increase support for environmental protections and initiatives.
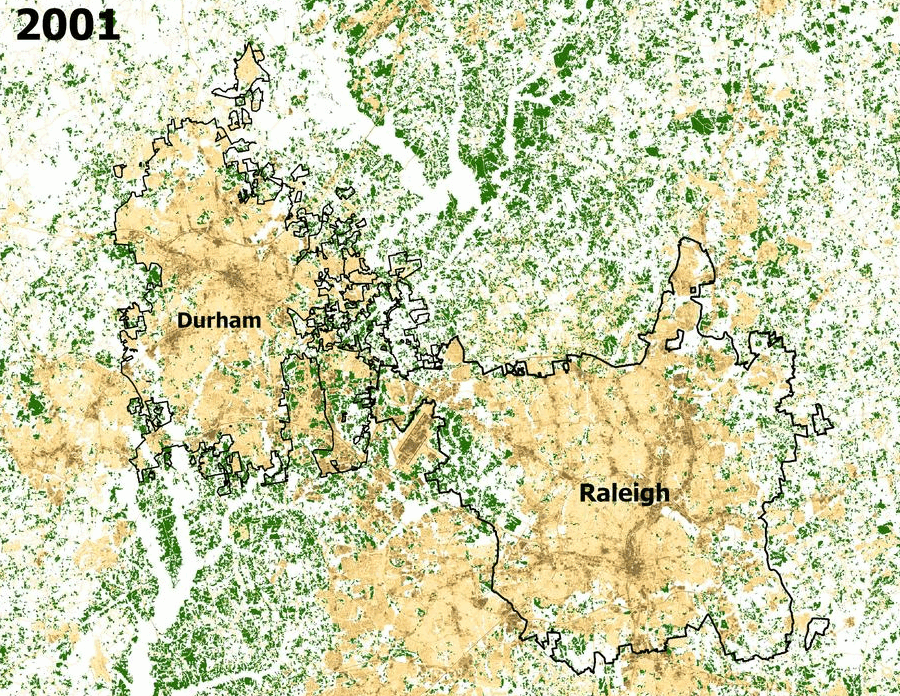
This map highlights the rapid increase of development in one of the fastest growing areas in the U.S., the Raleigh-Cary metropolitan area.
From 2000 to 2020, the population of Raleigh increased over 50%, according to U.S. Census Data. Surrounding towns, Cary and Morrisville experienced population booms of 94,536 to 174,721 and 5,208 to 29,630 respectively. The economic and cultural gains that coincide with an increased population can do wonders for an area but can also have environmental consequences.
A time lapse map of the Raleigh-Cary metropolitan area, using National Land Cover Data (NLCD) from the Multi-Resolution Land Characteristics (MRLC) consortium, contains satellite imagery of forestry and medium to high intensity development in Raleigh from 2001, 2011 and 2019.
From 2001 to 2019 the developed land cover (in tan hues) has replaced forestry (in green), specifically in the Research Triangle located between Raleigh and Durham. The increase of developed land over time aligns with the rise of urbanization and has resulted in an increase of impervious surfaces made of water-resistant materials like asphalt, concrete, brick, stone. Rooftops and compacted soils like sports fields are also impervious.
As impervious surfaces increase, tree canopy decreases. This leads to the urban heat island effect, when natural land cover is replaced with impervious surfaces that absorb and retain heat, resulting urban areas that are a lot warmer than the rural areas surrounding it. This is particularly a problem for energy efficiency as increased temperatures lead to increased energy costs and extreme heat events.
Tree canopy helps reduce the impact of the urban heat island effect as they provide shade to buildings that reflect heat, can deflect radiation from the sun that provide cooler temperatures to entire communities without expelling additional energy.
Map of the Month – March

Joy Ward and Bianca Acha-Morfaw
In honor of Women’s History Month, our March map pays tribute to Mária Telkes, a Hungarian-American scientist whose contributions to the field of solar energy research earned her the nickname “The Sun Queen.” Telkes is best remembered for her invention of the solar distiller, which was included in the military’s emergency medical kits in World War II. The solar distiller was also the first solar-powered heating system designed for residences. Telkes is remembered as one of the world’s foremost solar energy pioneers, with over 20 solar energy-focused patents.
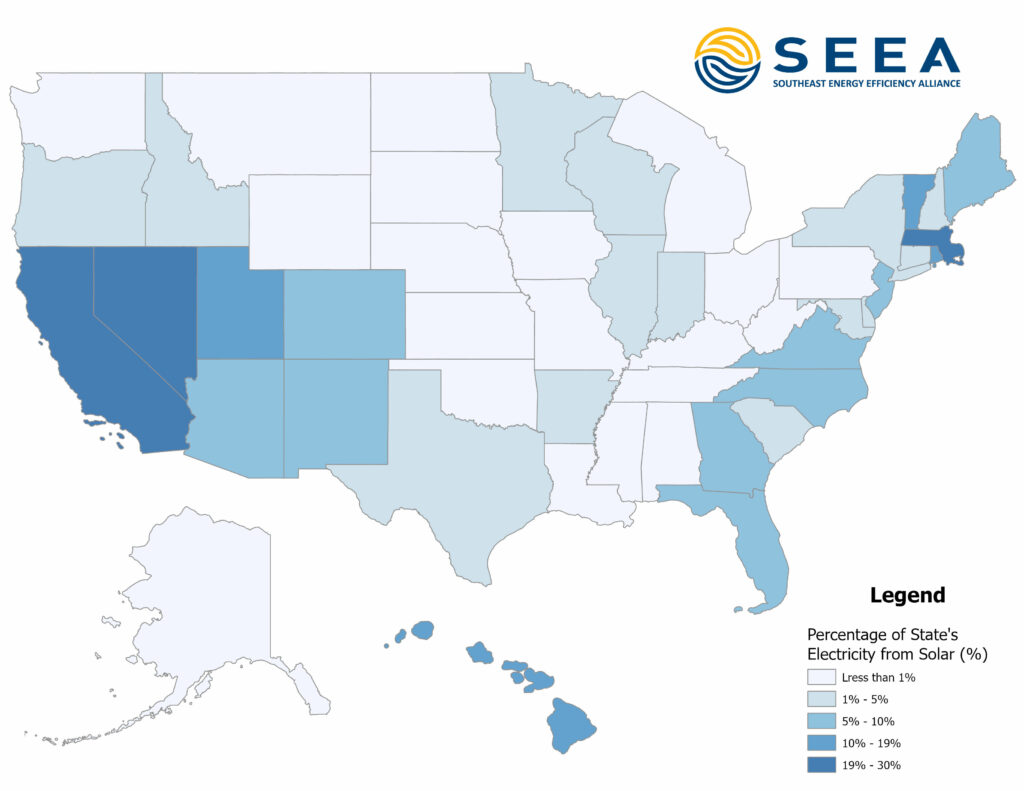
This month’s map shows the percentage of electricity generated from solar by both small-scale and utility-scale facilities across the United States. The map was created using data from the Solar Energy Industries Association (SEIA), a national non-profit trade association that supports the U.S. solar-energy industry.
More solar electricity is generated on the east and west coasts compared to inland states. Indicated with a darker hue, California, Nevada, and Massachusetts, have the highest percentages of solar-generated electricity at 27.32%, 23.32%, and 19.33%, respectively. The highest-ranking southeastern state, North Carolina, generates 8.92% of its electricity from solar. While most states are increasing their use of solar, 40% of states currently generate less than 1% of their electricity using solar panels.
Solar energy is becoming more accessible. In 2022, the U.S. Department of Energy’s Berkeley Lab reported a record increase in utility-scale solar generation. New installations are predicted to triple by 2030 as costs have fallen more than 75 percent since 2010, with utility companies increasing commitments to renewable energy and creating resources to aid residents in their solar installation process. Decreased costs, along with the passage of the Inflation Reduction Act, which contains incentives and tax breaks, should expand the advantages of using solar.
While utilities are helping educate residents on the solar installation process, Solar and Energy Loan Fund (SELF), an affordable financing nonprofit, is providing communities with access to low-cost financing. SELF provides low-interest rate home improvement loans, with a credit-free application process. These loans can be used for solar installations along with other types of sustainable property improvements.
When coupled with other energy efficient designs and technologies, renewable energy can work in tandem to increase affordability and mitigate the impacts of climate change by advancing decarbonization and reducing greenhouse gas emissions.
Map of the Month – February

William D. Bryan, Ph.D. & Joy Ward

Map: Southeast Energy Efficiency Alliance.
In honor of Black History Month, our February map pays homage to David Crosthwait, a Black engineer and inventor who designed heating, ventilation and air conditioning systems. One of his greatest contributions was developing heating systems for Rockefeller Center and Radio City Music Hall in New York. Today he is remembered for holding 39 patents that addressed a range of heating and ventilation problems. In 1971, he became the first Black person named a fellow of the American Society of Heating, Refrigeration, and Air Conditioning Engineers.
This month’s map visualizes the type of heating fuel households use at the county level across the United States for occupied housing units. It was created using data from the American Community Survey conducted by the U.S. Census Bureau.
Nationwide, most people rely on utility gas or electricity to heat their homes. Forty-seven percent of households use utility gas to fuel their heating equipment, while 39% use electricity. The remaining fuel types, bottled tank and fuel oil, are common in the Midwest and Northeast, respectively. In the South, electricity is most common with 68% of households using it as a source of heat, while just a quarter use utility gas.
One reason why the South has a high percentage of electricity use is because our region has a lower heating load and electric utilities have led successful heat pump installation programs. Despite this, urban centers such as Atlanta, Birmingham, Little Rock, Louisville, and Memphis predominately use utility gas. While this map suggests that the South is heavily electric, there are still millions of households in the Southeast that are eligible for the electric appliance tax credits and rebates available through the Inflation Reduction Act. These incentives can reduce the cost of energy efficient appliances like electric heat pumps, which are well-suited to the needs of Southern homes and dramatically reduce household energy consumption.
On March 15 at 2 p.m., hear from regional experts about how we can leverage federal funding to help low-income renters access energy efficient technology for their homes. Register for How to Make Clean Energy Upgrades More Accessible to Renters today.
Map of the Month – January
William D. Bryan, Ph.D. & Joy Ward
We are excited to introduce a new addition to SEEA’s blog this year – the Map of the Month. Every month, our research team will share a map that explores energy efficiency in the Southeast.
Map: Southeast Energy Efficiency Alliance.
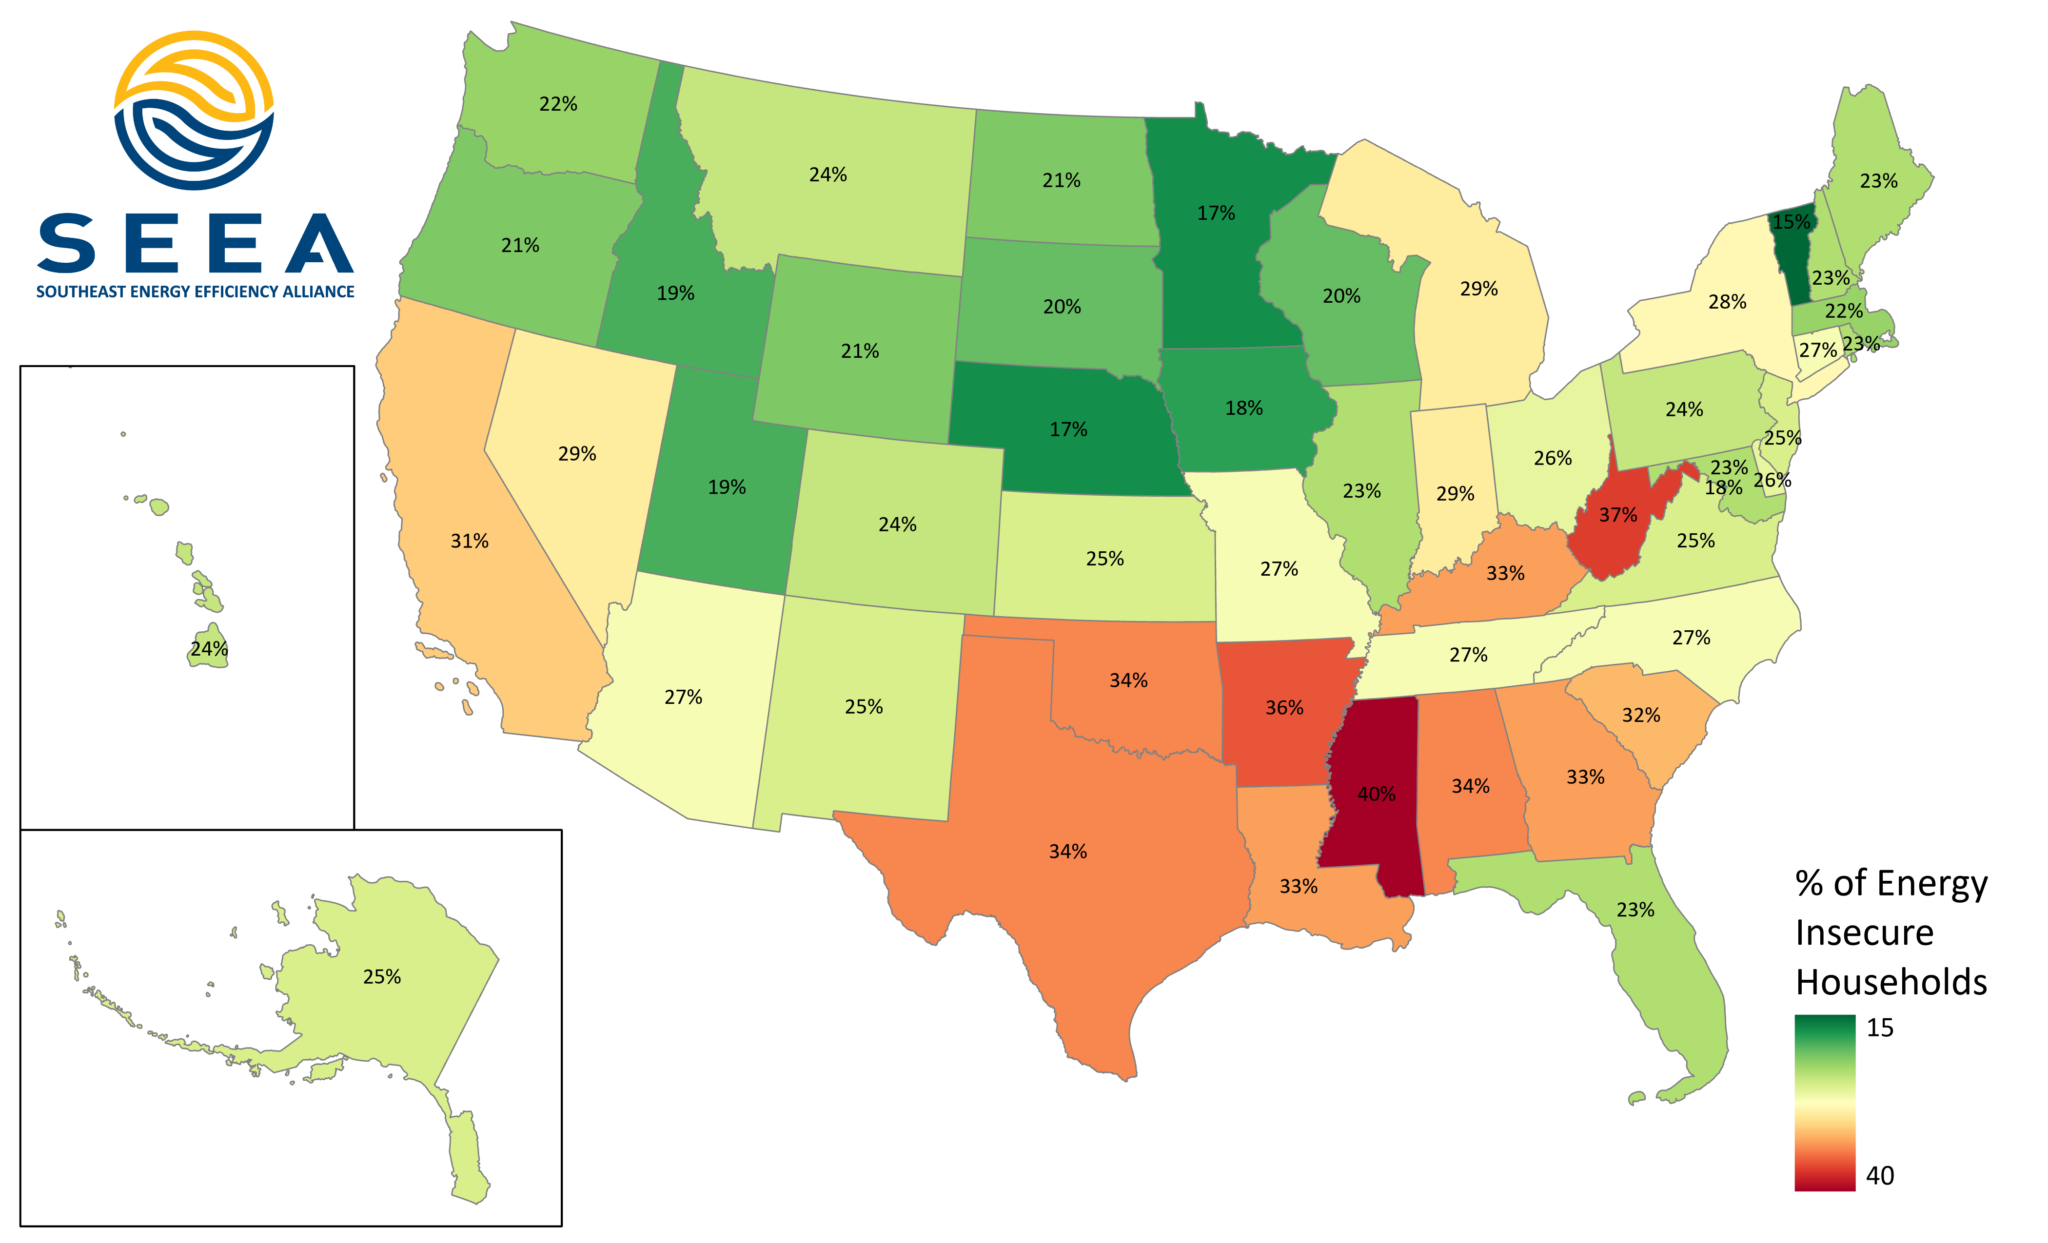
Millions of people in the South who struggle to pay their electric and gas bills every month are threatened with energy insecurity, or when a household cannot maintain vital energy services like heating and cooling. Energy insecurity undermines the health, safety and affordability of housing. The COVID-19 pandemic has only exacerbated this crisis.
Using new state-level data from the Energy Information Administration’s 2020 Residential Energy Consumption Survey (RECS), this map shows that people living in the Southeast experience the highest rate of energy insecurity in the country. In Mississippi, where 2 out of 5 households struggle to keep on the lights and heat, people are more likely to be energy insecure than anywhere else in the U.S. Of the 9.3 million energy insecure homes in the Southeast, nearly one-third are in Florida and Georgia. People experiencing energy insecurity are at greater risk for respiratory illness, poverty, and being unable to survive or recover in the face of extreme weather.
Beginning with a report and StoryMap, published in 2021, our research team has led SEEA’s work in identifying the historical and current systemic issues that contribute to energy insecurity in the Southeast. In 2022, SEEA announced the Southeast Energy Insecurity Project and continues to advance energy efficiency as a mitigation tool to help people in the Southeast live in healthier, more comfortable homes. You can hear more about how to reduce energy insecurity in our upcoming webinar, Promoting Knowledge and Engagement – Addressing Energy Insecurity in the Gullah Community on Wednesday, Jan. 25 at 11 a.m. ET.